Your site-location study, in minutes
Validate a location before you sign: the real population, its purchasing power, the competition and the area's real-estate prices — computed on the exact perimeter, exportable as a report.

What does a site-location study answer?
Four questions decide whether a location performs — or not. All four together, not just one.
How many potential customers live in the area?
Population and number of households on the exact perimeter (isochrone), from INSEE data — not a rough circle.
Can they afford your offer?
Disposable income, occupational categories and household composition, to assess local purchasing power against your positioning.
Who already serves them?
The competitors present in the area, with their Google rating and number of reviews. Potential is only worth its net of existing supply.
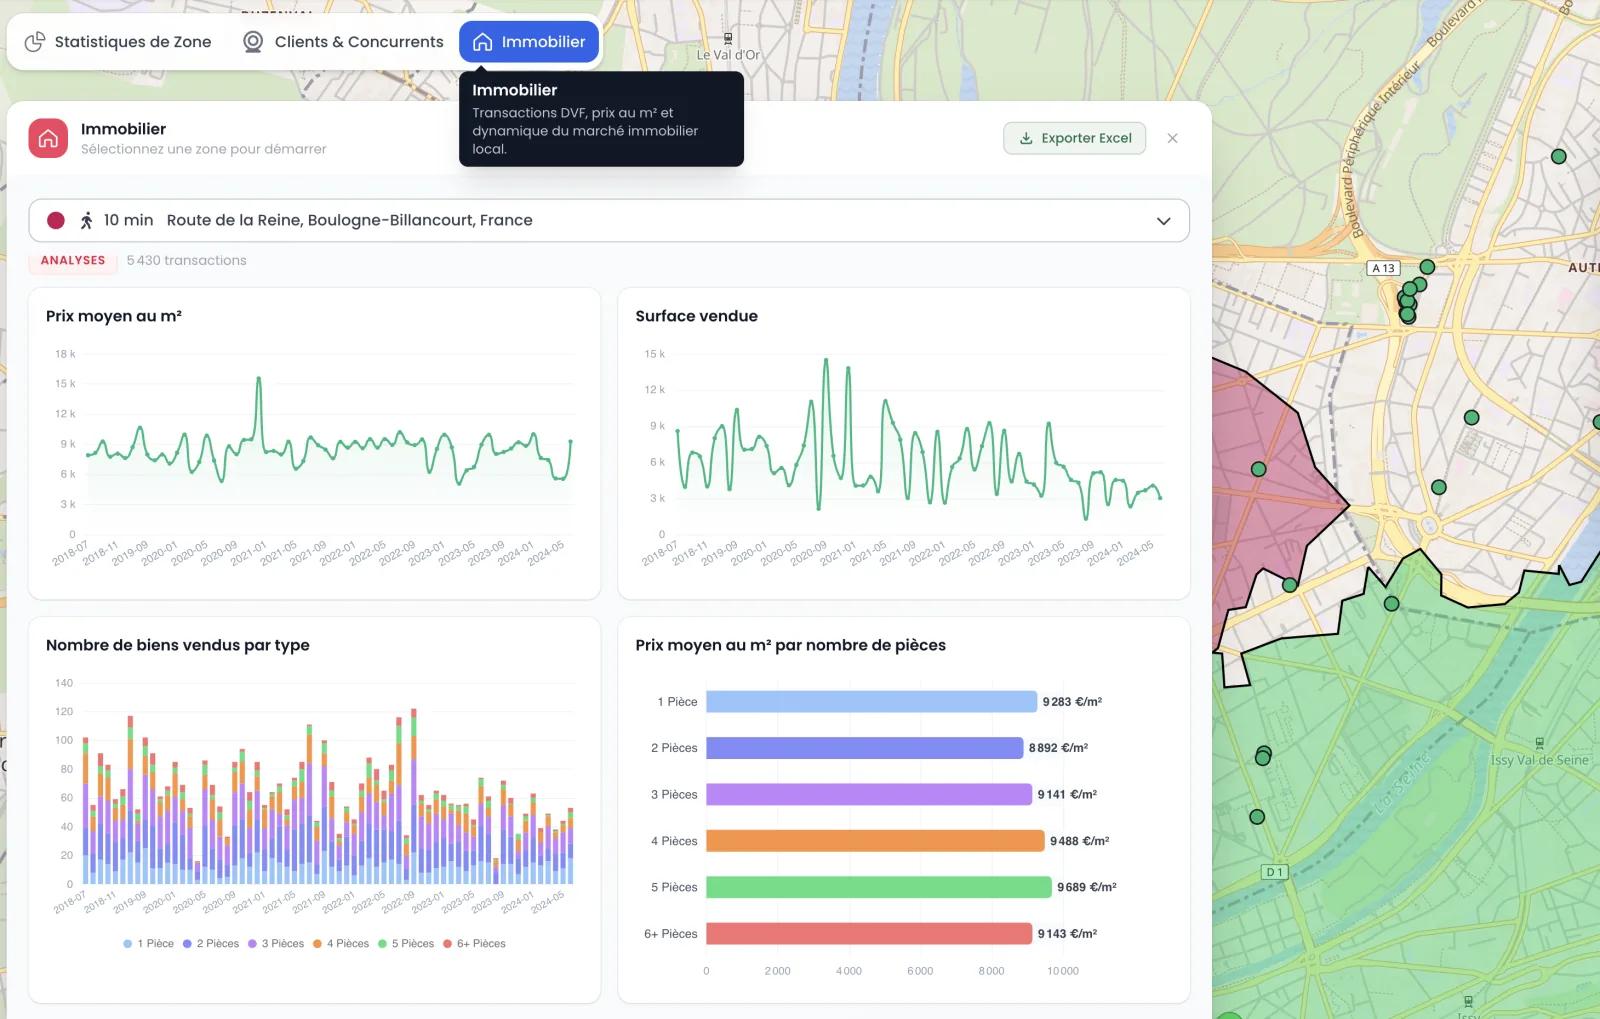
At what real-estate cost?
Price per m² from real DVF transactions, to negotiate the lease at the right point in the cycle.
The 4-layer method
Cross four data layers on the real zone. The crossover — not a single indicator — drives the GO / NO-GO.
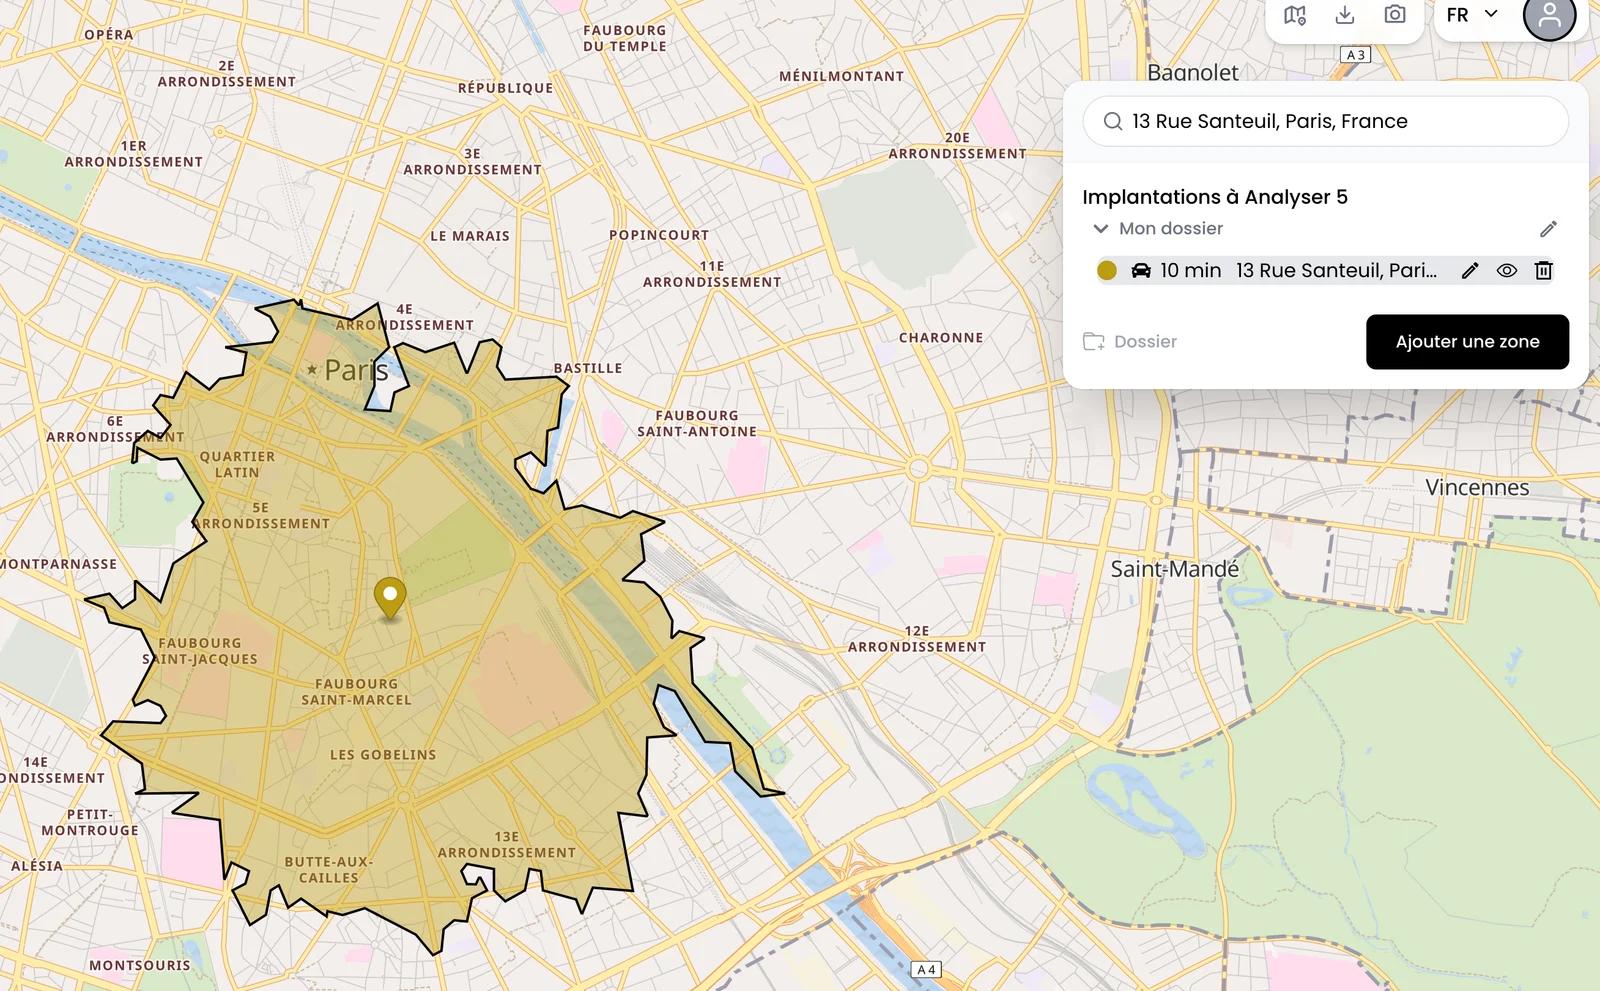
- Étape 1
Define the real zone
Draw an isochrone (drive or walk time), an administrative boundary (municipality, IRIS, postcode) or a manual polygon. A customer thinks in minutes, not kilometers.
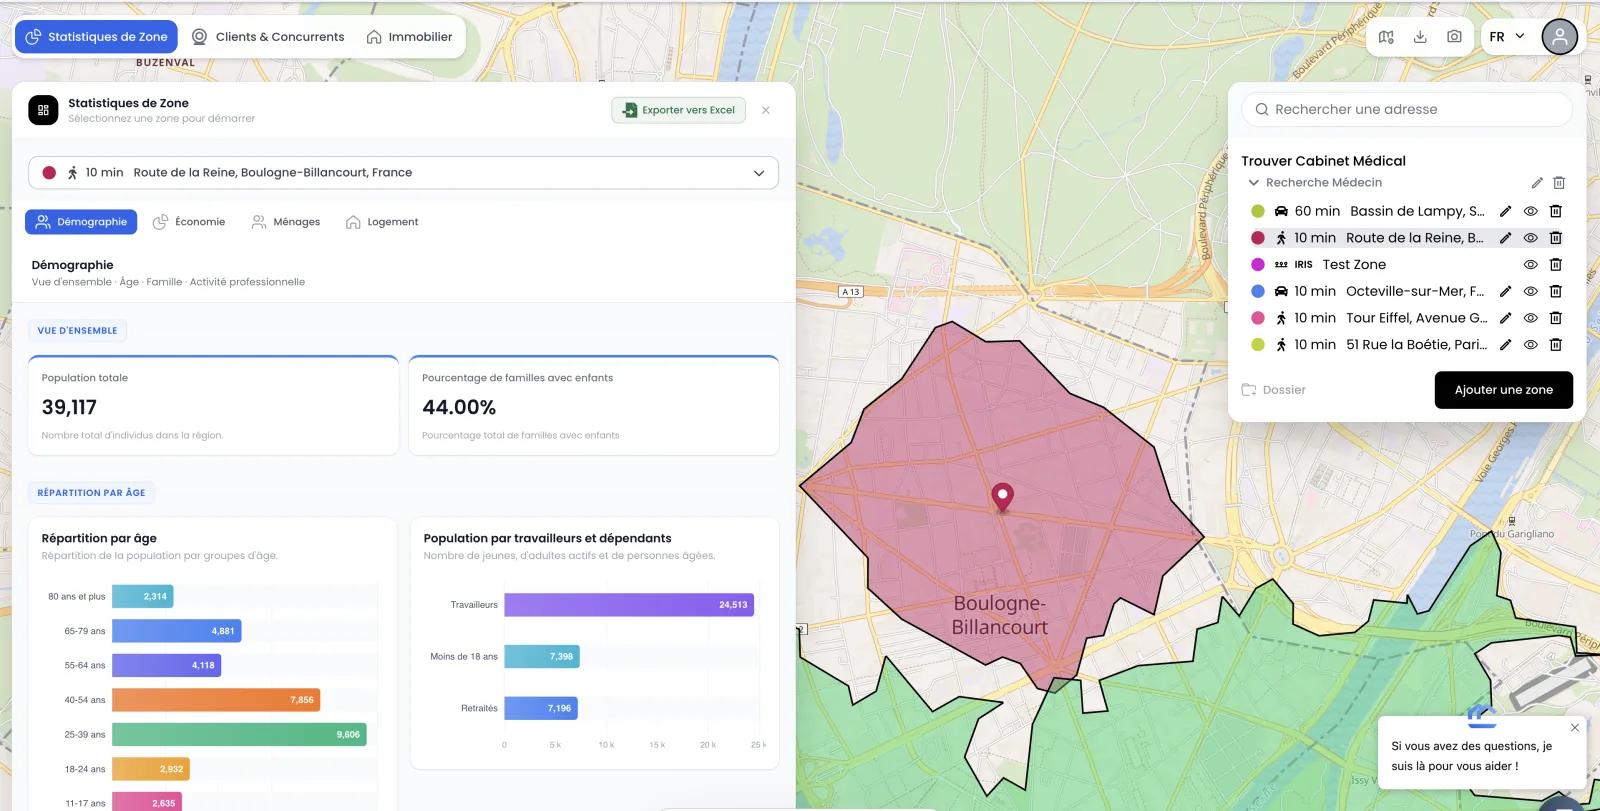
- Étape 2
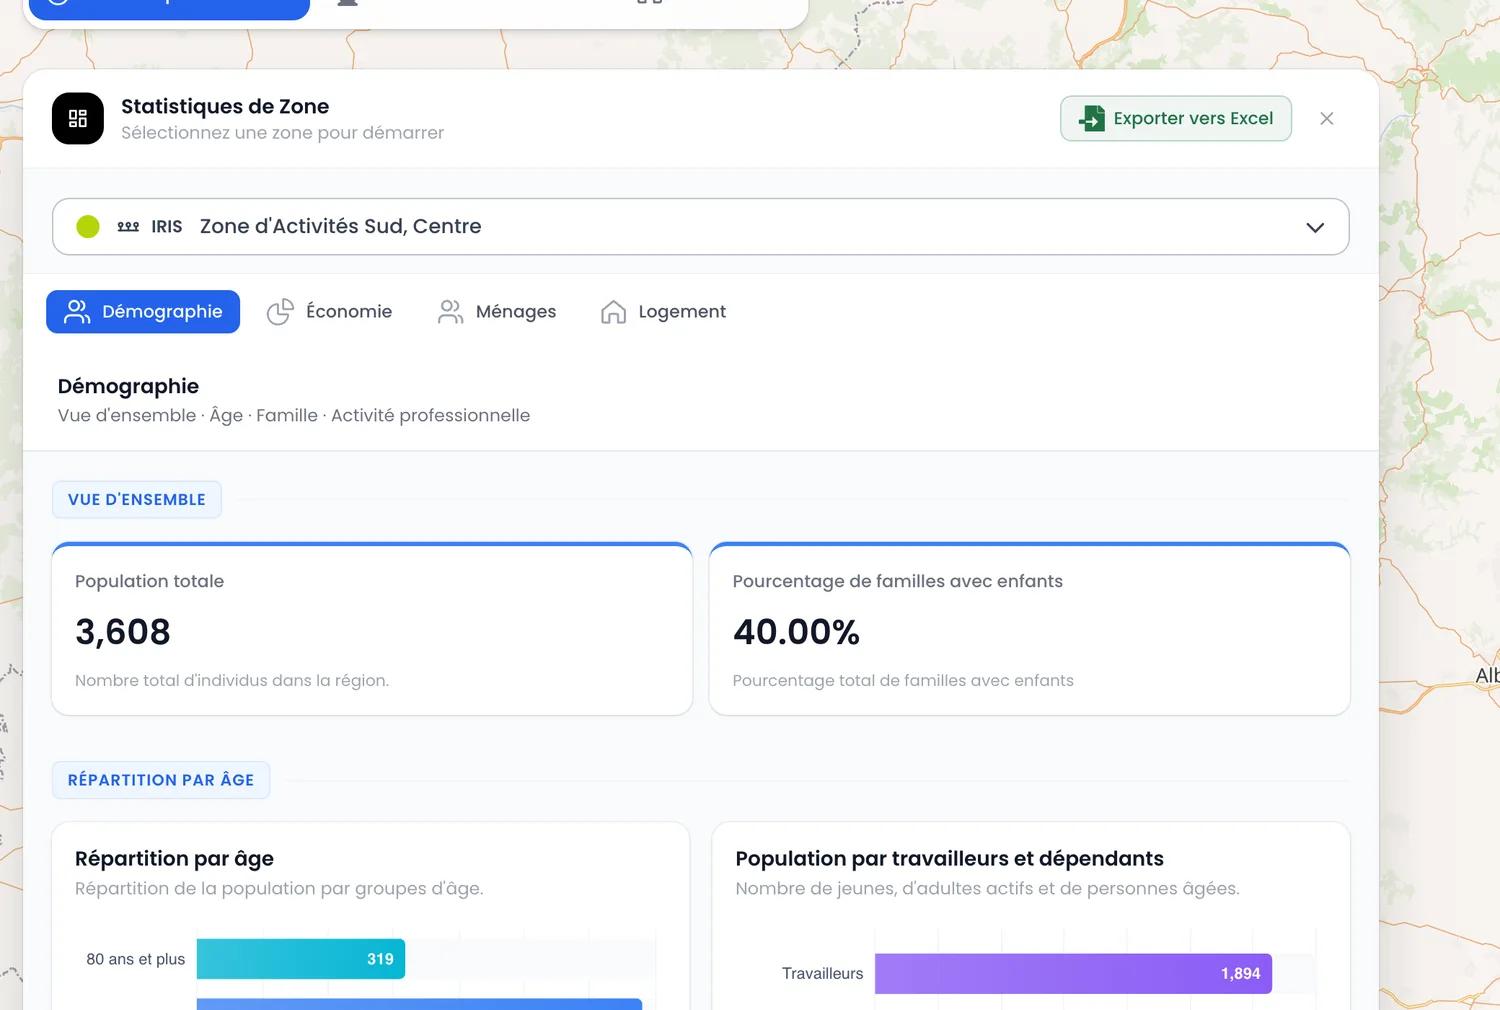
Measure the population (INSEE)
Population, households, disposable income, occupational categories, household composition and housing appear for the exact perimeter in seconds.
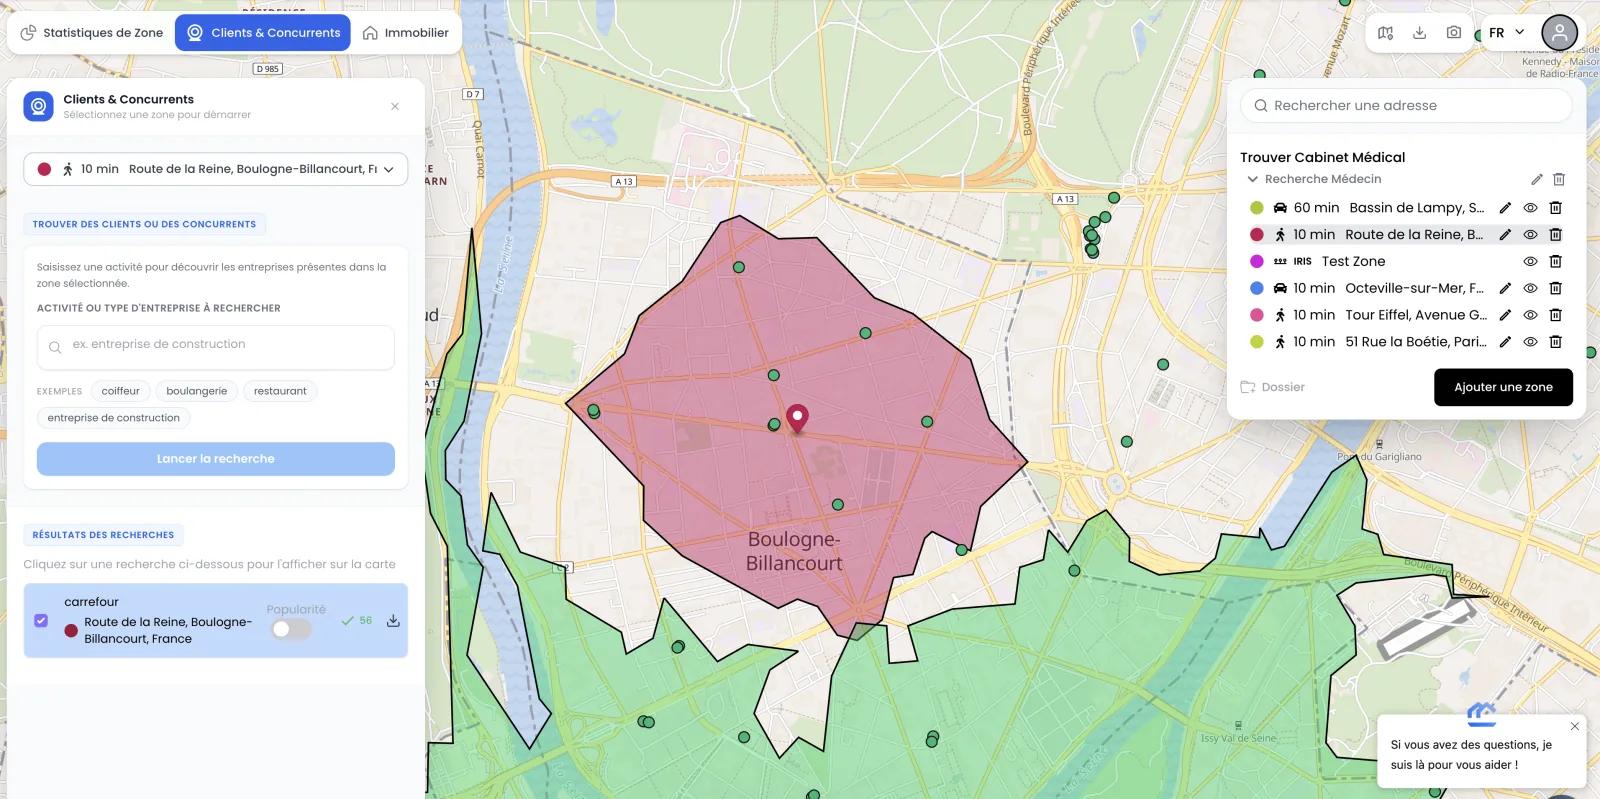
- Étape 3
Analyze the competition
List the competitors in the area by activity, with their Google rating and number of reviews, exportable to Excel. A dense but saturated zone is sometimes worth less than a smaller, under-served one.
- Étape 4
Check the real-estate cost (DVF)
Average price per m², transaction volume and trend for the area, from DVF data. Commercial rent follows sale prices with a 12-18 month lag.

Official data, on your exact zone
Public sources, aggregated to the perimeter you draw — not a whole municipality mixing different micro-markets.
INSEE Filosofi
2019 vintage (200 m grid)
Disposable income and living standards. The reference for assessing purchasing power in a zone.
INSEE Households & Housing
2018 vintage (IRIS)
Household composition, presence of children, occupancy status and housing type.
DVF
data.gouv.fr
Real real-estate transactions: price per m² by property type, volumes and trend.
Google Maps
Real time
Competitors in the area by activity, with their rating and number of reviews.
What you get
A sourced, quantified file, exportable as PDF or Excel — ready for a banker, a franchisor or a client.

Frequently asked questions
Does a site-location study replace the field visit?+
No. It qualifies the zone (population, competition, prices) so you only visit the locations worth it. Footfall counting and lease negotiation stay your job — the tool gets you there with the right numbers.How long does a study take?+
A few minutes per location, versus half a day by hand. That's what lets you compare 3 or 4 sites on the same grid before choosing.Where does the data come from?+
From official public sources: INSEE (demographics, income), DVF (real-estate prices), Google Maps (competitors). We aggregate it for your exact zone.Can I export the study?+
Yes, as PDF and Excel. All exports are included, no extra cost, no quota.How much does it cost?+
The site-location study is included in the Growth plan at €29 excl. VAT / month, no commitment. You can try it free before subscribing.