Analyze the demographics of a catchment area
Population, income, occupational categories, households: get INSEE indicators for any French area in one click.
What questions does this analysis answer?
The essential indicators to understand an area before making a business decision.
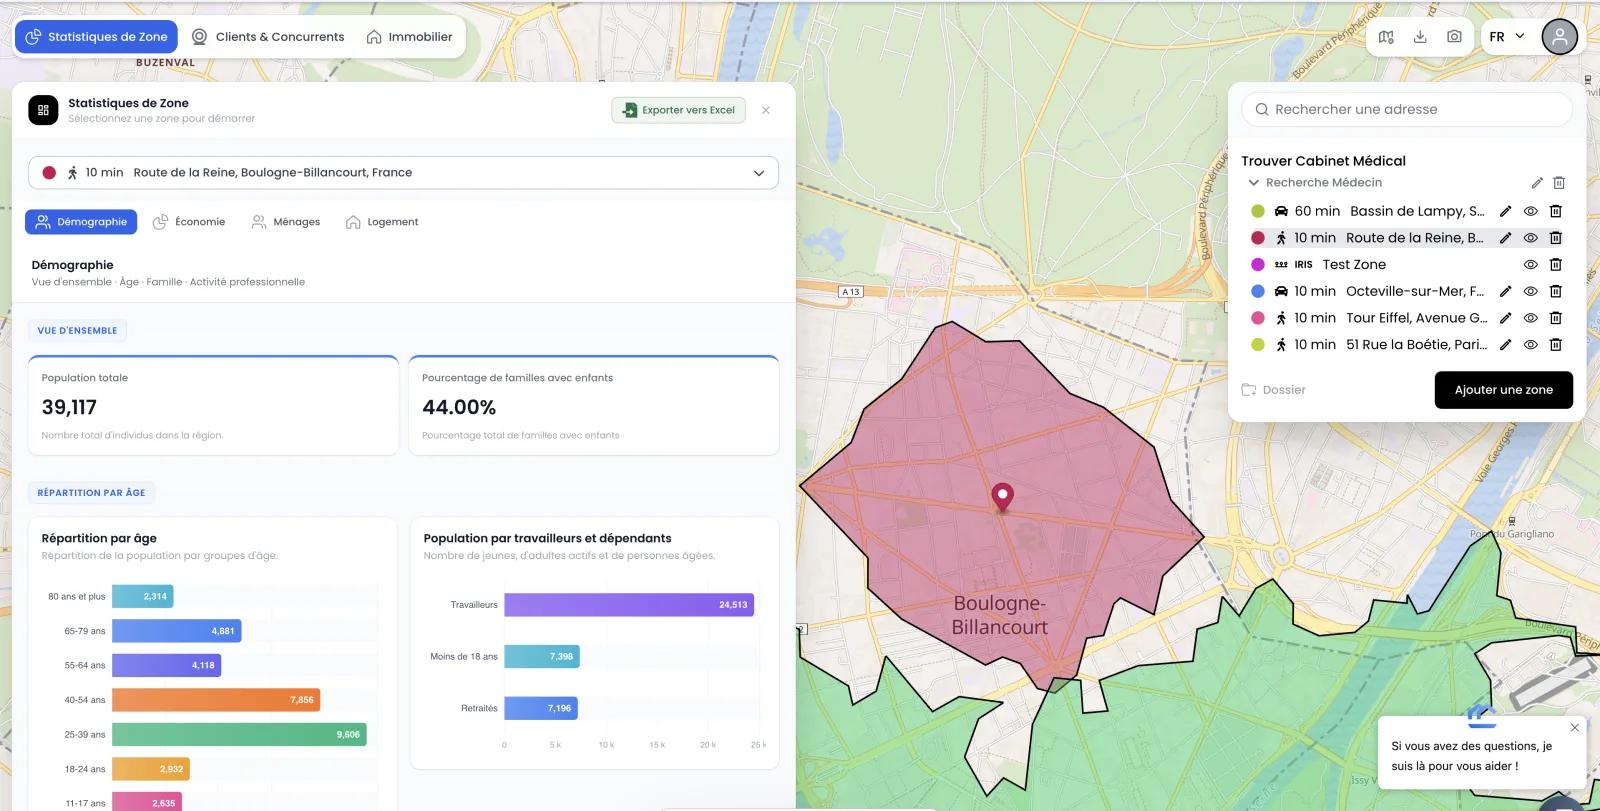
What is the total population of the area?
View the population within the exact boundaries of your zone, computed from INSEE's 200 m grid.
What share of residents are managers or higher-income professionals?
Get the breakdown by occupational category to assess the purchasing power of the area.
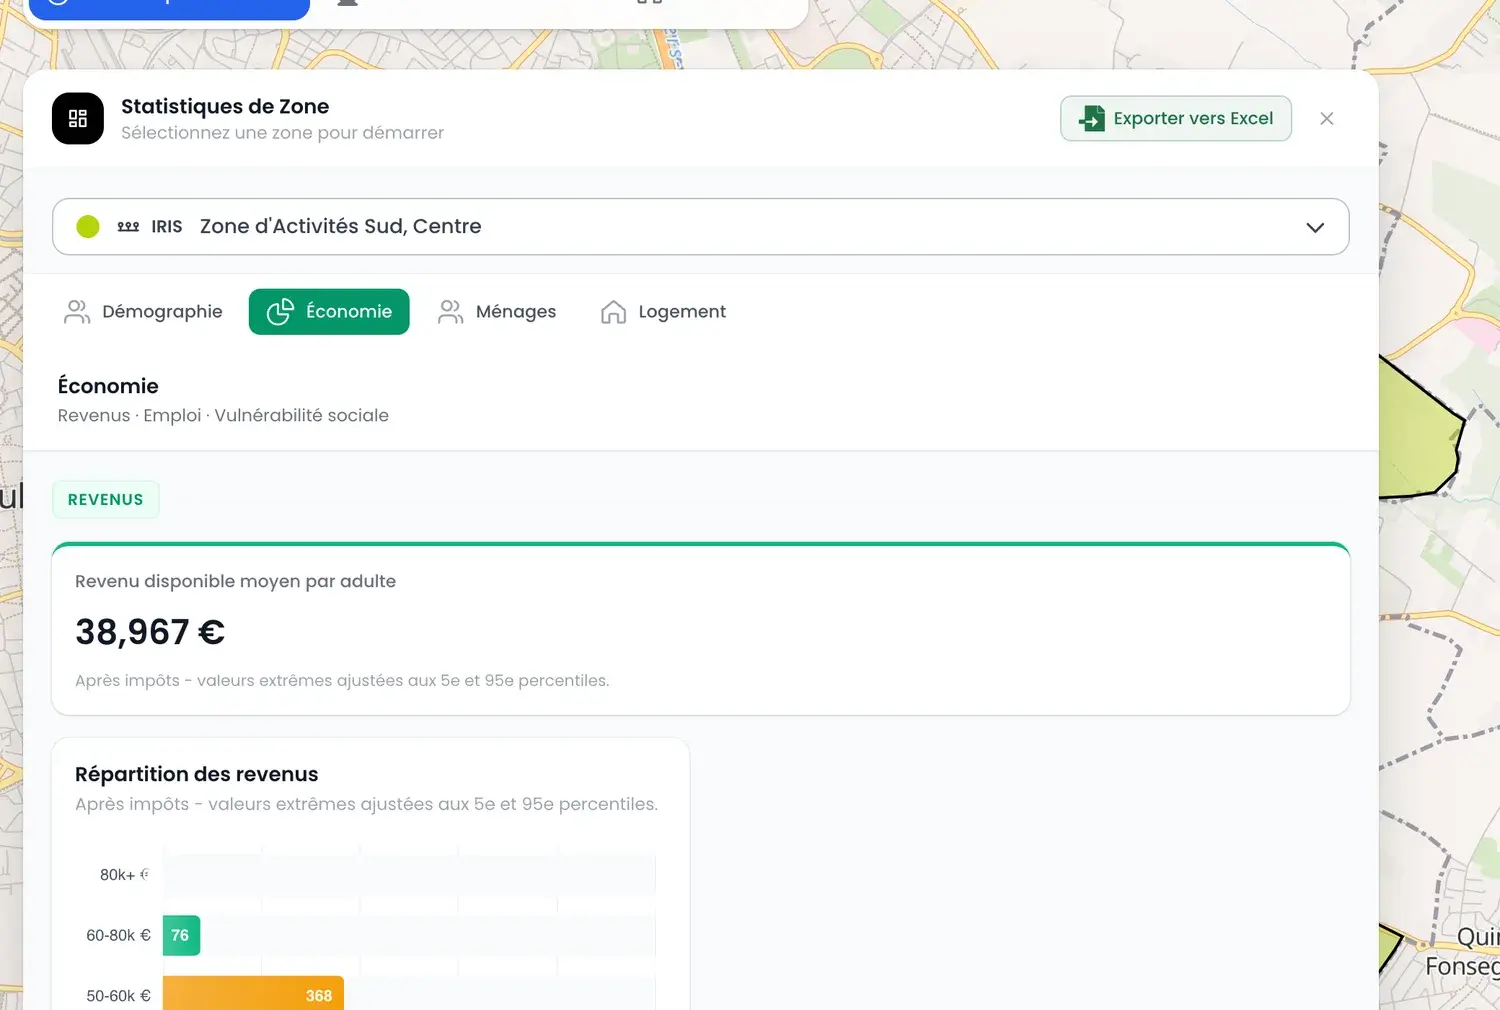
What is the median household income?
Get the median income and income deciles for your zone using Filosofi data.
What is the household composition?
Families with children, single-person households, owners/renters: all INSEE household indicators in seconds.
How it works
Four steps to get an actionable demographic report.
- Étape 1
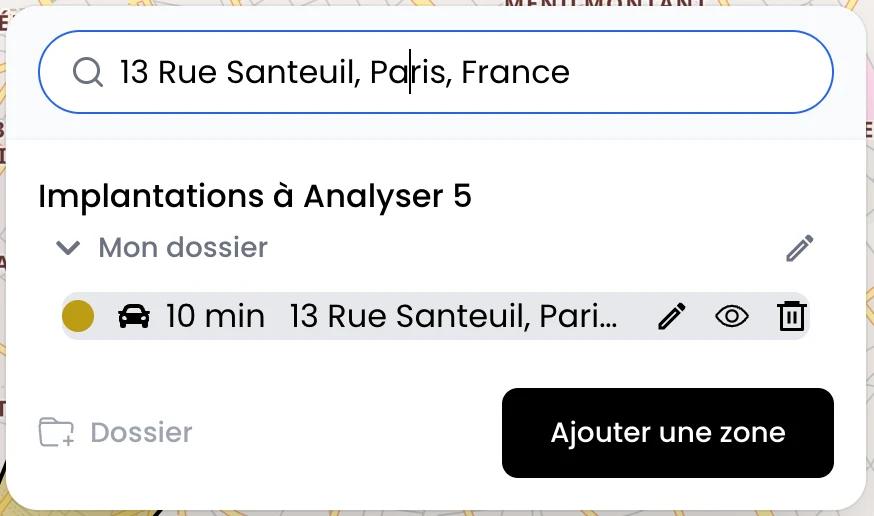
Enter an address
Type the address around which you want to analyze demographics. You can also import an existing zone.
- Étape 2
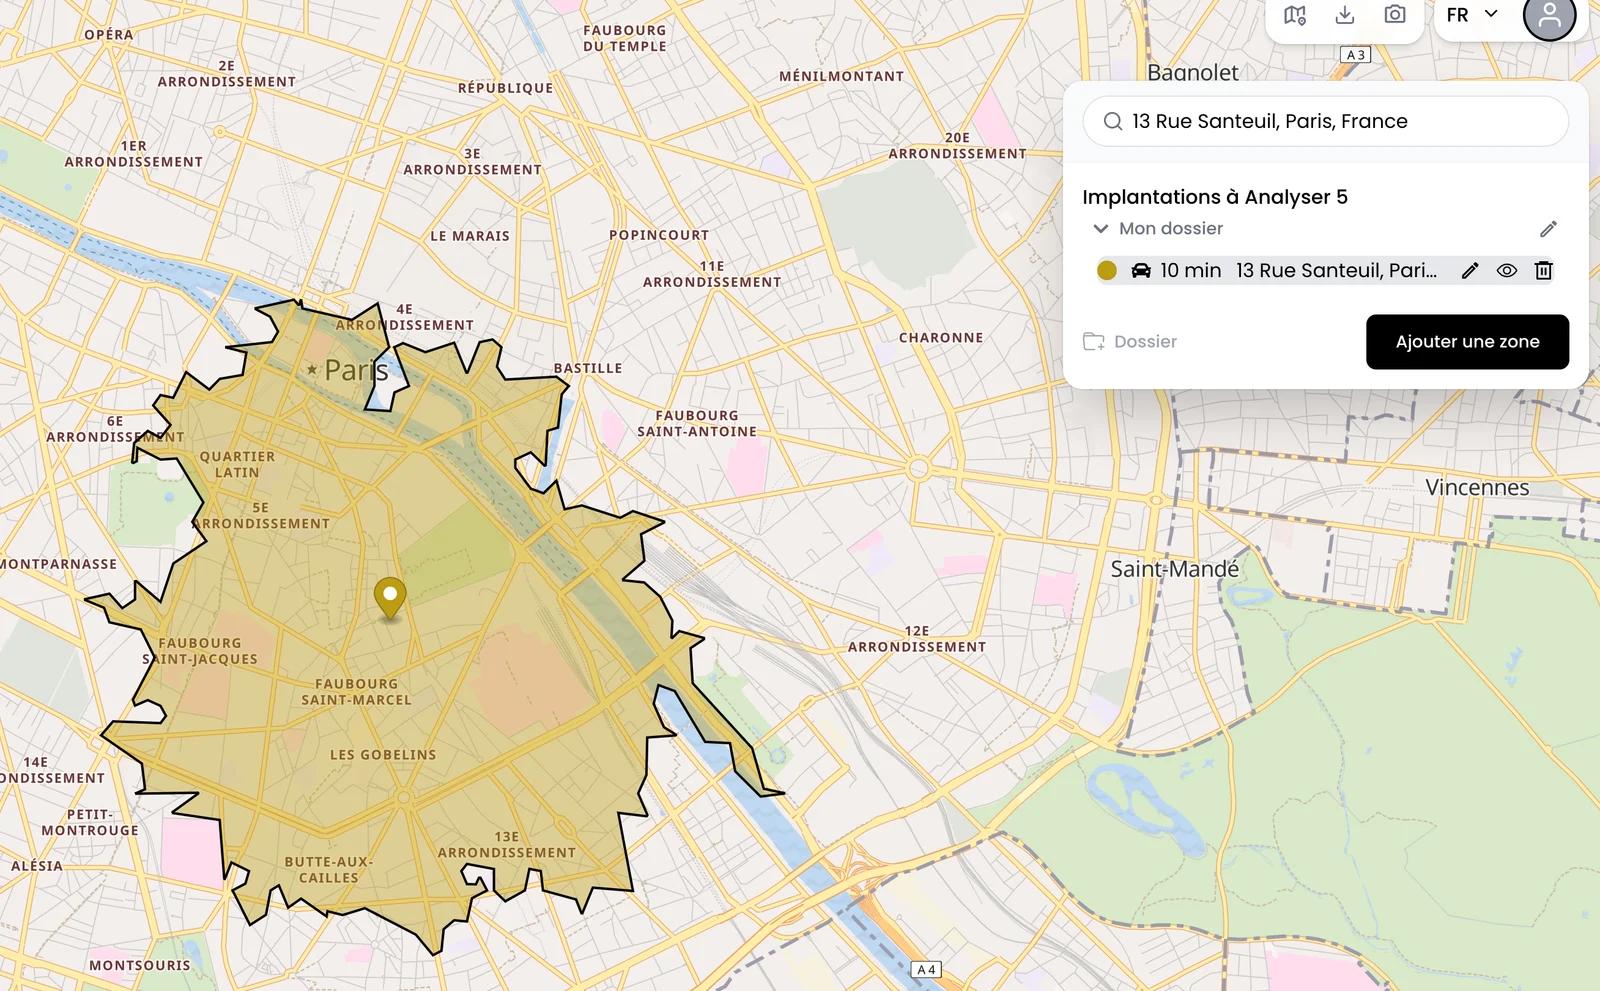
Define your study area
Choose a radius, a drive/walk isochrone, or draw a polygon by hand. All options are available.
- Étape 3
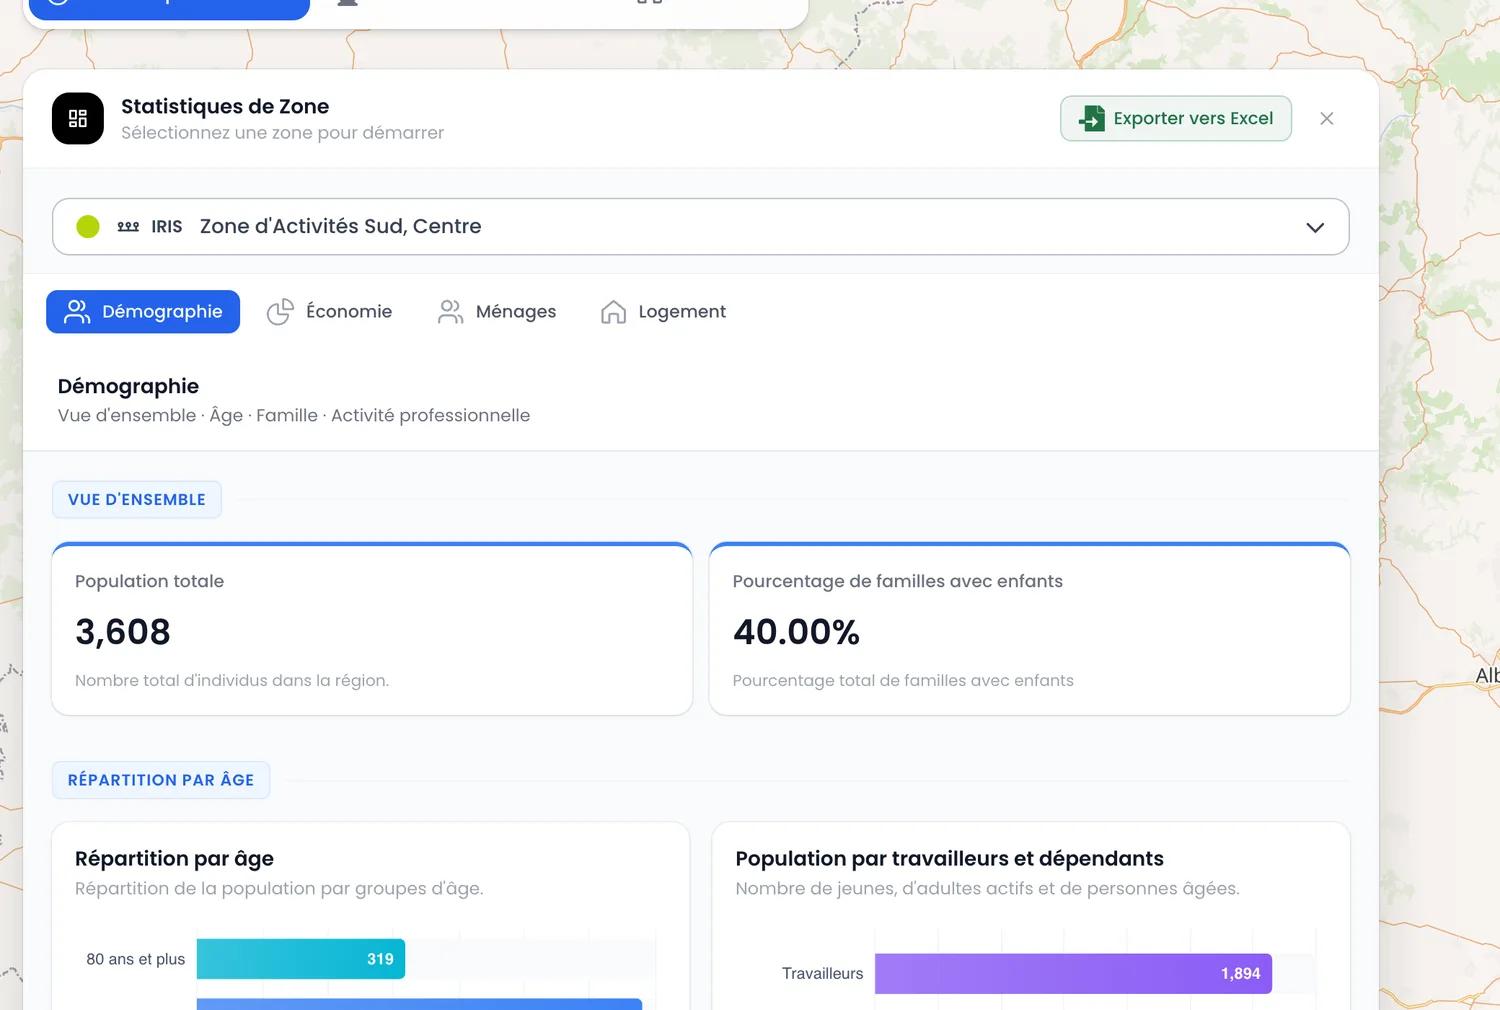
View the indicators
Population, income, occupational categories, and household composition appear for the defined zone in seconds.

- Étape 4
Export your report
Download the report as PDF or Excel to share with a client or include in a study.

Data from INSEE
Public, official sources, aggregated to the exact perimeter of your zone.
INSEE Filosofi
2019 vintage (200 m grid)
Disposable income, living standards, deciles. The reference for assessing purchasing power in a zone.
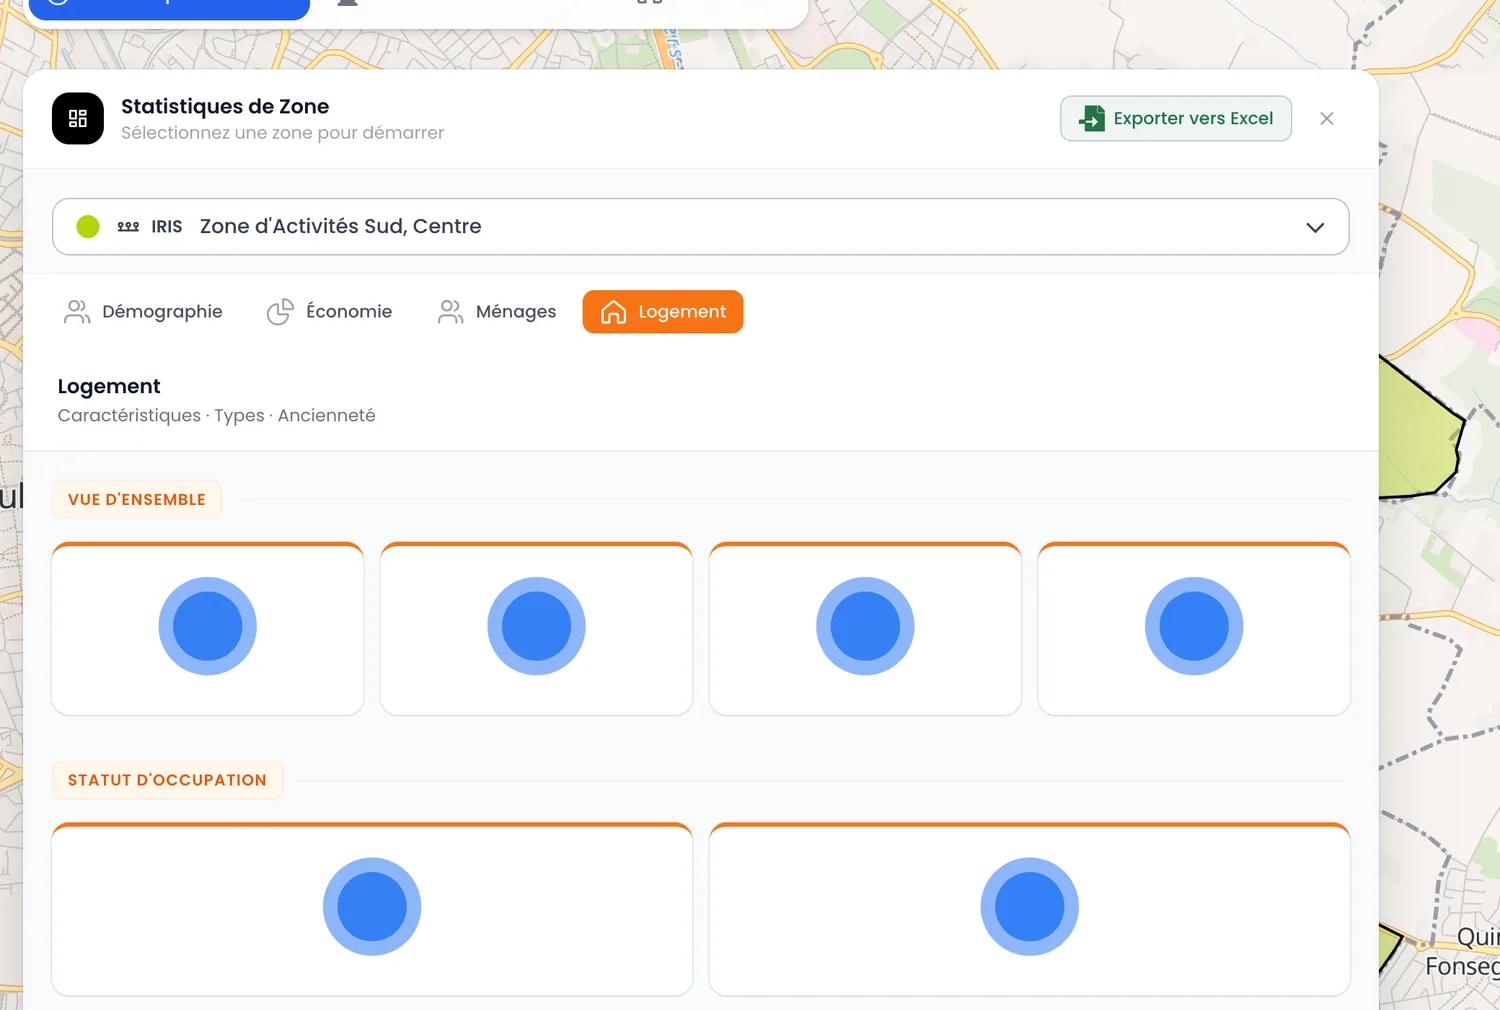
INSEE Logement
2018 vintage (IRIS)
Housing types, occupancy status (owner/renter), residence sizes. Enables profiling of the housing stock.
INSEE Ménages
2018 vintage (IRIS)
Household composition, presence of children, average size. To understand the family structure of an area.
What a report looks like
A few real extracts from reports generated by our users.
Frequently asked questions
Where does the data come from?+
All demographic data comes from INSEE's public databases (Filosofi, Logement, Ménages). We handle aggregating it for your exact zone.How recent is the data?+
Filosofi 2019 (200 m grid), Logement 2018 (IRIS), Ménages 2018 (IRIS). These are the latest vintages of these databases that we have integrated into the platform.Can I analyze any French area?+
Yes, anywhere in metropolitan France. You define the zone by radius, isochrone (travel time), or manual polygon.Can I export the report?+
Yes, as PDF and Excel. All exports are included in the Growth plan — no extra cost, no quota.How much does demographic analysis cost?+
Demographic analysis is included in the Growth plan at €29 excl. VAT / month, with no commitment. See the pricing page for details.