Over 7,000 accounts have already created an area
Draw your catchment area and decide on real figures
Start for free, then compare your sites, analyse local competition and organise your network's territories using INSEE data, property transactions and your own indicators.
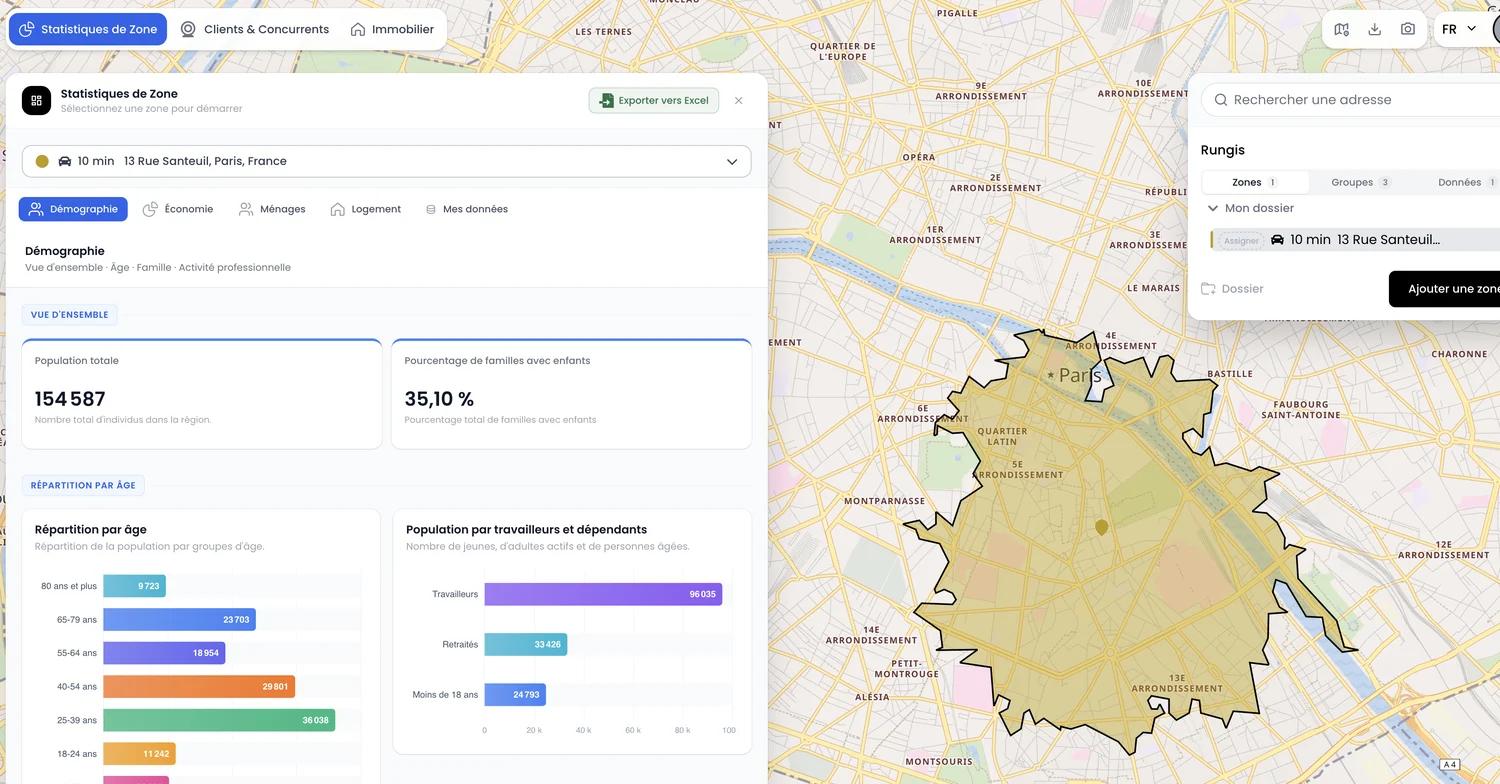
- 1The area you drewBy travel time, by distance, on an administrative boundary, or freehand.
- 2The figures for that areaINSEE population, households and income aggregated on this exact perimeter — not on the whole municipality.
- 3Your saved areasFiled in folders, grouped by store or by sales rep, reopened months later.
Cited by
Customer feedback
What the people who use it say


Who it is for
Three trades, one question that comes back every month
None of these decisions is taken once. The free plan is for testing the method; the subscription is for the people who repeat it.
- I develop a network
Networks and multi-site
Every application assessed on the same grid, every overlap spotted before signing, every territory grouped by store.
Geomarketing for a network - I run studies for clients
Consultants and firms
One method reused from assignment to assignment, citable public sources, and an export the client can verify.
Tool for location consultants - I organise sales territories
Sales teams
Territories drawn in real travel time, grouped by rep, and weighed on the same figures before being redistributed.
Organise sales territories
Validating a single site before you sign? Start with the location study
How it works
From an address to a decision, in five steps
Five steps. The fifth is what separates a tool tried once from a tool actually used.
- Create the areaAn address, a travel mode, a duration. Or an administrative boundary, or a freehand polygon.
- CompareSeveral areas read side by side on the same indicators: population, income, competitors, price per m².
- Add your own dataImport one indicator per municipality — revenue, customers, potential — and it aggregates onto every area.
- ExportTables to Excel, the map as an image, for the meeting that will decide.
- Come back for the next areaYour areas and folders are waiting. That is where the subscription stops being a cost and becomes a working tool.
The data
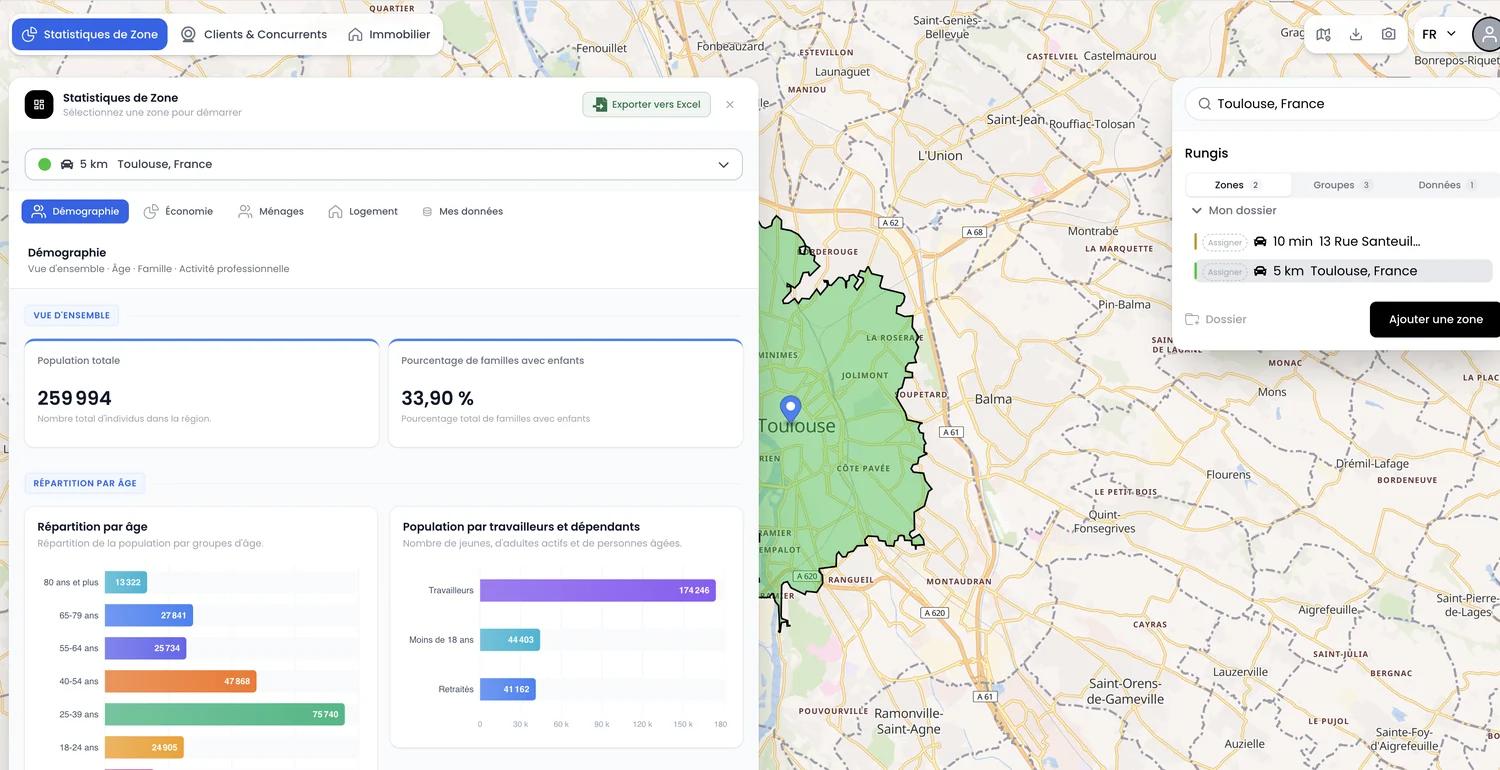
The data you cross-reference on one area, gathered in one place
| What you read on the area | Where it comes from | Why it matters |
|---|---|---|
| Population, households, income, occupation | INSEE, aggregated on the exact perimeter | Analysing a whole municipality when customers come from six streets averages your market with the rest of the territory. |
| Businesses and competitors present | Google Maps, by activity category | With their rating and review count. Run the same search again months later and you get today's state — the tool keeps no history, the comparison stays yours. |
| Price and volume per m² | DVF, real transactions (data.gouv.fr) | Entry cost is part of the decision, not a separate study. |
| Your own indicators | Your import, by municipality | Public data describes a territory; yours describes your business on it. |
| Statistics per sales territory | Your groupings of areas | Read a whole territory at once, and export it to Excel, instead of area by area. |
Pricing
Free to try, Growth to work
The free plan is enough to test the method on a real area. The subscription pays off when the analysis becomes recurring.
Free
Draw your areas and organise your territories
0 €HT/mo
Unlimited drawing, up to 10 saved areas
Areas by drive time, distance, freehand or postcodes
Sales territories: group your areas by rep or store
Total population and breakdown by town
Preview of 15 customer/competitor results
Données INSEE détaillées : revenus, CSP, ménages, logement
Prix et transactions immobilières (DVF)
Import de vos propres données
- For recurring use
Growth
Every dataset, including your own
49 €HT/mo
Tout le plan Gratuit, plus :
Zones sauvegardées illimitées
Unlimited customer/competitor searches, all results
All INSEE data: demographics, income, households, housing
Property prices and transactions (DVF)
Your own data per town (revenue, potential, customers) aggregated by area
Statistics per sales territory, not just per area
Excel export of every analysis
The price is published here, not at the end of a demo: you subscribe on your own, online, and you cancel the same way. No sales call is needed to learn the rate or to get started.
Continue based on what you need
Six ways in, depending on what you need to decide.
Chalandise
Analyse your first area
Draw an area on a real address and read who lives there, who already serves them and at what price per m². No card required.
*10 saved areas on the free plan. Growth at €49 excl. VAT/month, no commitment.
1
Draw an area by travel time, by distance or on an administrative boundary.
2
Cross-reference INSEE demographics, the competitors in the area and DVF property prices.
3
Keep your areas, add your own indicators and export the lot to Excel.